Download this example as Jupyter notebook or Julia script.
SW8 - Kagome Antiferromagnet
This is a Sunny port of SpinW Tutorial 8, originally authored by Bjorn Fak and Sandor Toth. The goal is to calculate the linear spin wave theory spectrum for the $\sqrt{3} \times \sqrt{3}$ order of a Kagome antiferromagnet.
Load Packages
using Sunny, GLMakieBuild a Crystal with $P\overline{3}$ space group,
a = 1
latvecs = lattice_vectors(a, a, 10a, 90, 90, 120)
cryst = Crystal(latvecs, [[1/2,0,0]], 147)
Crystal
Spacegroup 'P -3' (147)
Lattice params a=1, b=1, c=10, α=90°, β=90°, γ=120°
Cell volume 8.66
Class 1:
1. [1/2, 0, 0]
2. [0, 1/2, 0]
3. [1/2, 1/2, 0]
Build a System with antiferrogmanetic nearest neighbor exchange $J=1$.
S = 1
sys = System(cryst, (3, 3, 1), [SpinInfo(1; S, g=2)], :dipole)
J = 1.0
set_exchange!(sys, J, Bond(2, 3, [0, 0, 0]))
Initialize to an energy minimizing magnetic structure, for which nearest-neighbor spins are at 120° angles.
k = -[1/3, 1/3, 0]
axis = [0,0,1]
set_spiral_order_on_sublattice!(sys, 1; k, axis, S0=[cos(0),sin(0),0])
set_spiral_order_on_sublattice!(sys, 2; k, axis, S0=[cos(0),sin(0),0])
set_spiral_order_on_sublattice!(sys, 3; k, axis, S0=[cos(2π/3),sin(2π/3),0])
plot_spins(sys; dims=2)
Check energy. Each site participates in 4 bonds with energy $JS^2\cos(2π/3)$. Factor of 1/2 avoids double counting.
@assert energy_per_site(sys) ≈ (4/2)*J*S^2*cos(2π/3)Define a path in reciprocal space.
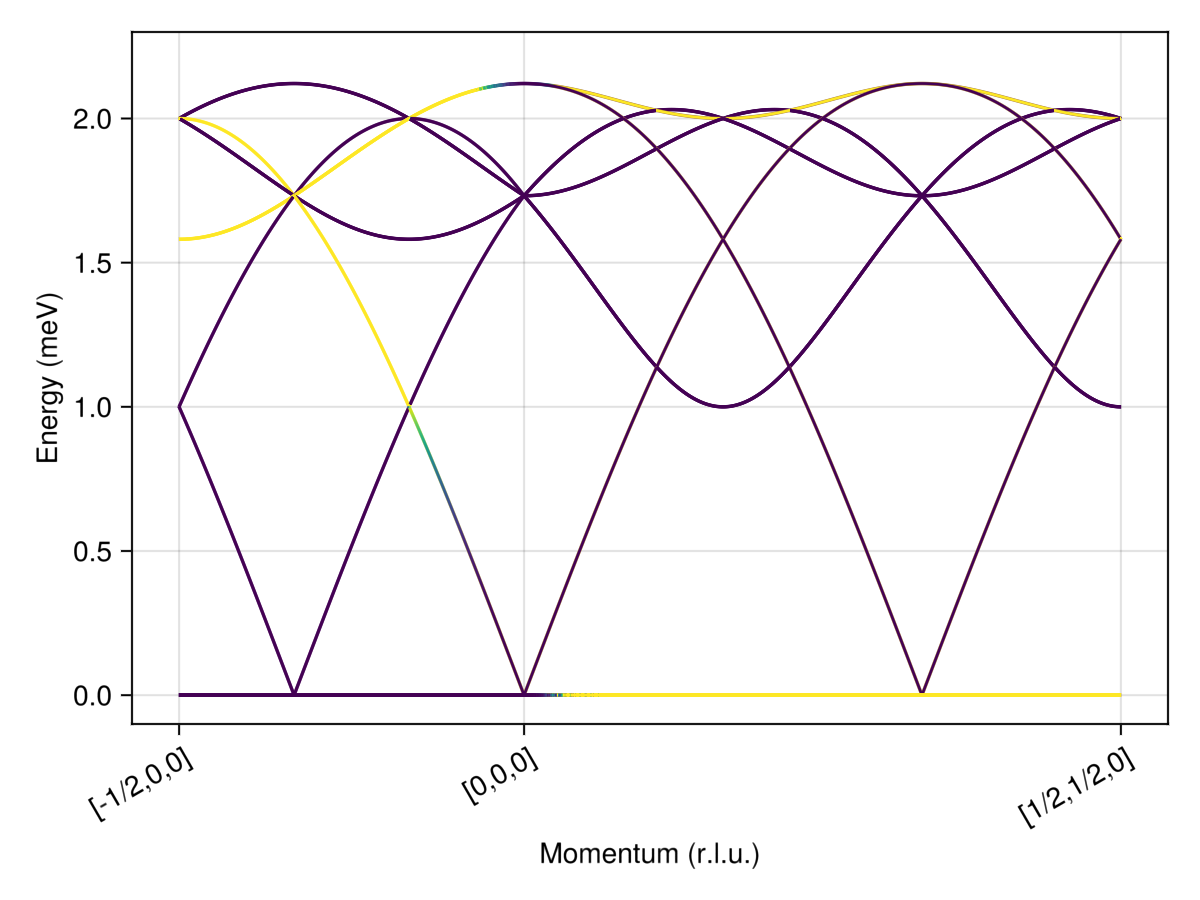
points_rlu = [[-1/2, 0, 0], [0, 0, 0], [1/2, 1/2, 0]]
density = 100
path, xticks = reciprocal_space_path(cryst, points_rlu, density);
Calculate discrete intensities
swt = SpinWaveTheory(sys)
formula = intensity_formula(swt, :perp; kernel=delta_function_kernel)
disp, intensity = intensities_bands(swt, path, formula);
Plot over a restricted color range from [0,1e-2]. Note that the intensities of the flat band at zero-energy are off-scale.
fig = Figure()
ax = Axis(fig[1,1]; xlabel="Momentum (r.l.u.)", ylabel="Energy (meV)",
          xticks, xticklabelrotation=π/6)
ylims!(ax, -1e-1, 2.3)
for i in axes(disp, 2)
    lines!(ax, 1:length(disp[:,i]), disp[:,i]; color=intensity[:,i], colorrange=(0,1e-2))
end
fig