Download this example as Julia file or Jupyter notebook.
SW03 - Frustrated J1-J2 chain
This is a Sunny port of SpinW Tutorial 3, originally authored by Bjorn Fak and Sandor Toth. It calculates the spin wave spectrum of the frustrated J1-J2 chain.
Load Sunny and the GLMakie plotting package.
using Sunny, GLMakieDefine the chemical cell for a 1D chain following the SW01 tutorial.
units = Units(:meV, :angstrom)
latvecs = lattice_vectors(3, 8, 8, 90, 90, 90)
cryst = Crystal(latvecs, [[0, 0, 0]])
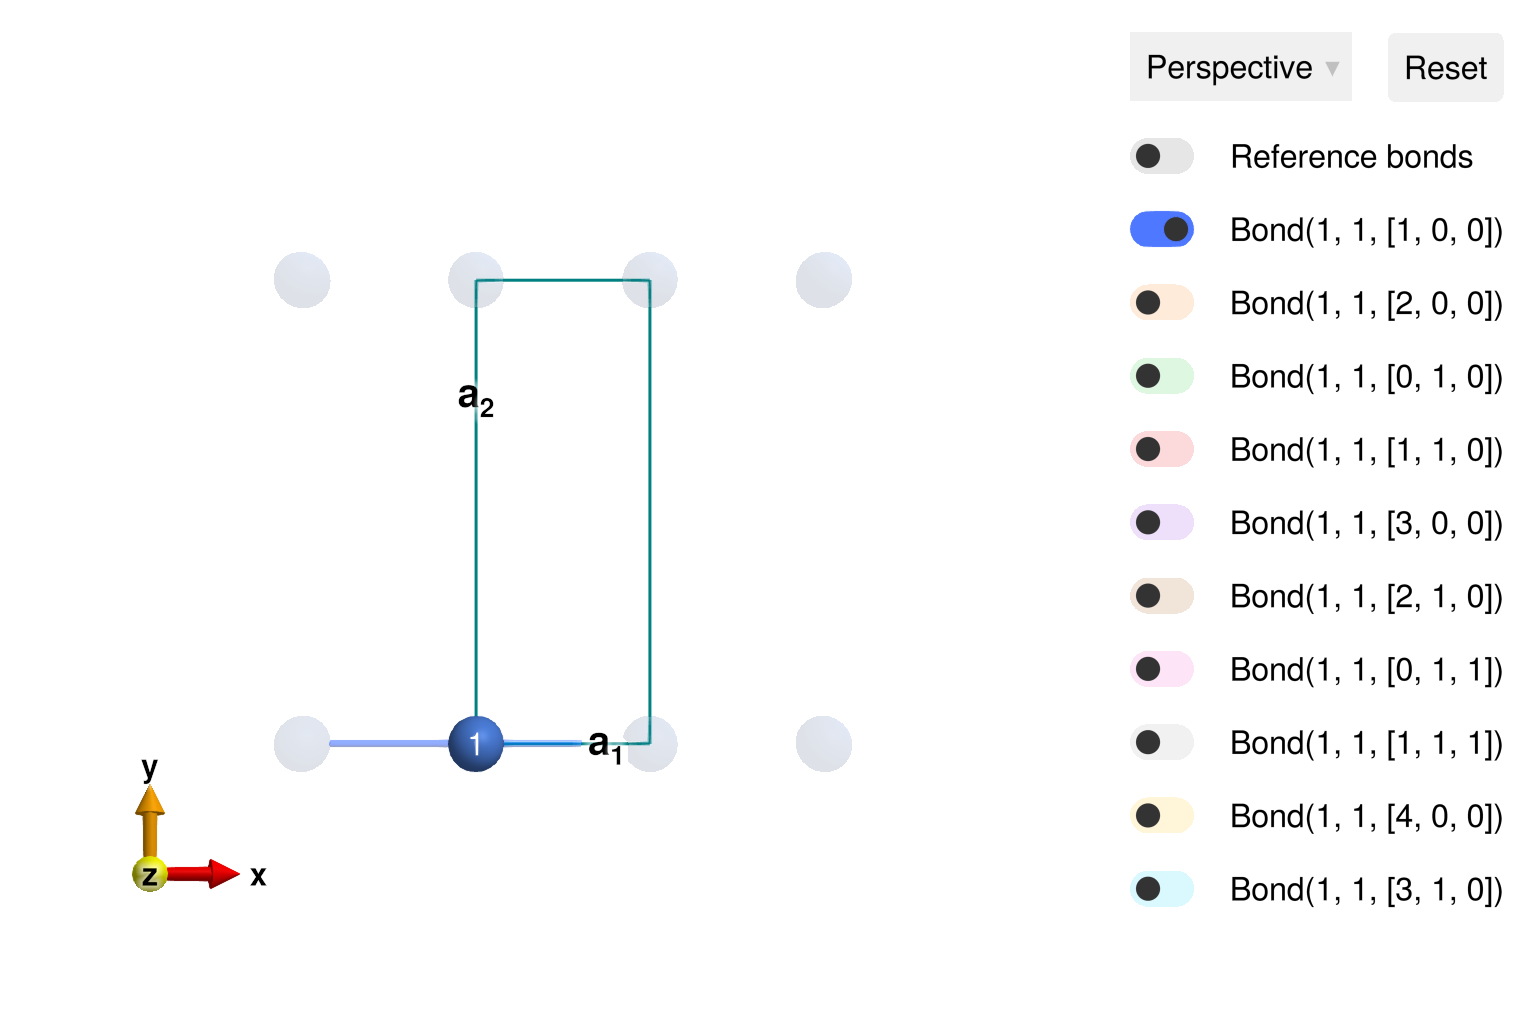
view_crystal(cryst; ndims=2, ghost_radius=8)
Construct a spin system with competing nearest-neighbor (FM) and next-nearest-neighbor (AFM) interactions.
sys = System(cryst, [1 => Moment(s=1, g=2)], :dipole)
J1 = -1
J2 = +2 * abs(J1)
set_exchange!(sys, J1, Bond(1, 1, [1, 0, 0]))
set_exchange!(sys, J2, Bond(1, 1, [2, 0, 0]))
Assuming a spiral order, optimize the propagation wavevector $𝐤$ starting from a random initial guess. Because all interactions are isotropic in spin space, the polarization axis is arbitrary.
axis = [0, 0, 1]
randomize_spins!(sys)
k = minimize_spiral_energy!(sys, axis; k_guess=randn(3))
3-element StaticArraysCore.SVector{3, Float64} with indices SOneTo(3):
0.7699465438373777
0.31181717536024806
0.76535873503874The first component of the order wavevector $𝐤$ has a unique value up to reflection symmetry, $𝐤 → -𝐤$. The second and third components of $𝐤$ are arbitrary for this 1D chain system. In all cases, the minimized energy has a precise value of -33/16 in units of $|J₁|$.
@assert k[1] ≈ 0.2300534561 || k[1] ≈ 1 - 0.2300534561
@assert spiral_energy_per_site(sys; k, axis) ≈ -33/16 * abs(J1)
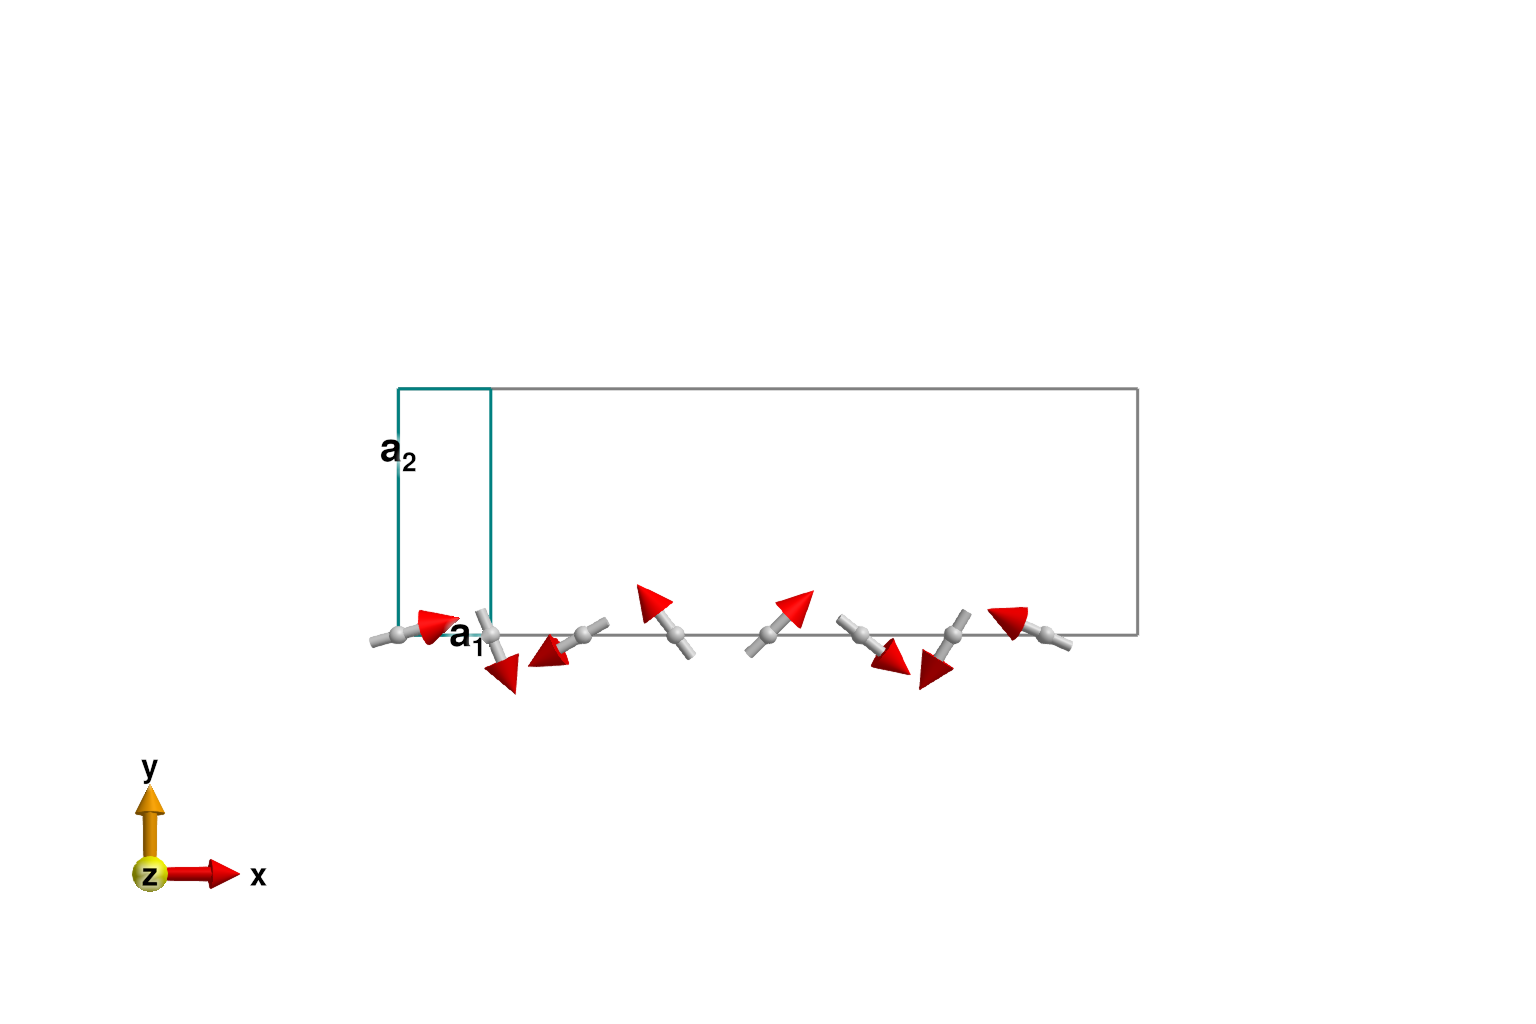
To view part of the incommensurate spiral spin structure, one can construct an enlarged system with repeat_periodically_as_spiral.
sys_enlarged = repeat_periodically_as_spiral(sys, (8, 1, 1); k, axis)
plot_spins(sys_enlarged; ndims=2)
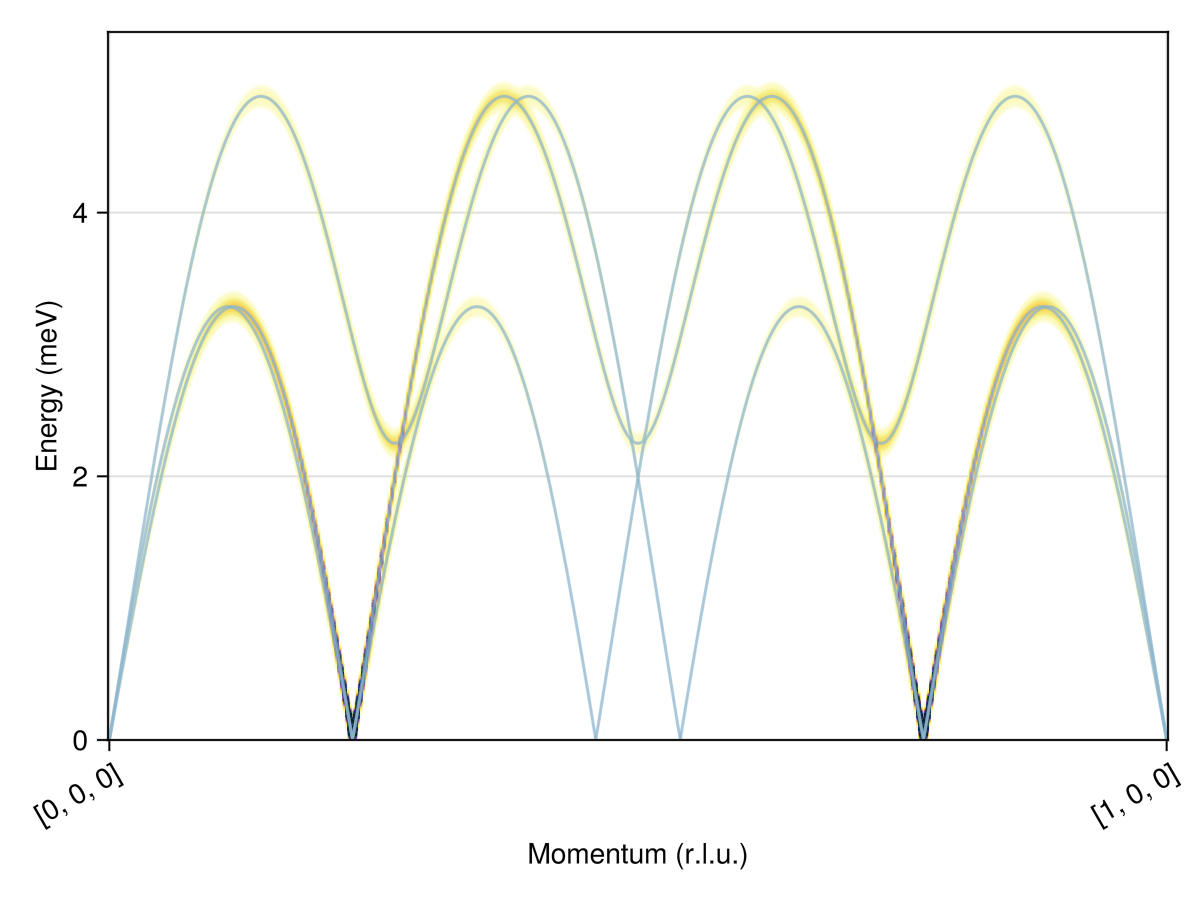
Use SpinWaveTheorySpiral on the original sys to calculate the dispersion and intensities for the incommensurate ordering wavevector.
swt = SpinWaveTheorySpiral(sys; measure=ssf_perp(sys), k, axis)
qs = [[0,0,0], [1,0,0]]
path = q_space_path(cryst, qs, 401)
res = intensities_bands(swt, path)
plot_intensities(res; units)